The (arguably) quite interesting history of the Gantt chart

The Gantt chart is a bar chart that illustrates a project schedule. It doesn’t sound particularly exciting, but it’s incredibly useful if you have lots of people working on lots of different things to try and get something done. Like a construction project, for instance.

We’ve just added a Gantt chart feature on SymTerra which we really think is a game-changer for your projects. Total visibility for the entire team for the duration of the project, with progress of each activity recorded along the way. Before you give it a try, let’s take a look at the history of the humble hero that is the Gantt chart

Henry Gantt

Despite a project tracking tool designed by Karol Adamiecki being used in Russia and Poland in the late 19th century, and Hermann Schurch’s similar chart being used widely across Germany by 1912, it’s Henry Gantt whose name has stuck and stood the test of time.

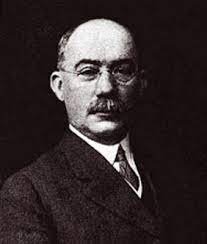
American mechanical engineer Henry Gantt’s chart was designed sometime between 1910 and 1915. He created this visualisation tool to measure productivity levels of employees and gauge which were under or over-performing. We can only imagine that Henry was incredibly fun at parties.

The Gantt chart was used by the United States in World War I, where hand drawn charts would have to be entirely rewritten every time a schedule would change. Spare a thought for those patient souls whenever you start to complain about how much admin you have to do.

The computer

In the 1980s, personal computers arrived, and people all over the world were able to create complex and elaborate Gantt charts whenever they felt like it, without having to draw the whole thing out by hand.

The internet then propelled things further, with collaboration and record keeping over networks allowing people to keep up to speed with projects from wherever they were in the world (when they weren’t looking at videos of cats, that is). More hi-tech solutions started to appear, and by 2012 almost all Gantt charts were made by software that could easily adjust to schedule changes. Primavera P6 turned up. Microsoft Projects did too. All of the project managers in construction used it seamlessly, and everyone on site lived happily ever after.

Not really. There were still loads of problems. Gantt charts were still mostly static documents that didn’t show detailed updates with progress from the site teams. They were usually looked at by project managers and schedulers and absolutely nobody else. They were still a bit of a mess, truth be told.

SymTerra to the rescue

And that’s where we stepped in. Our digital Gantt chart gives full visibility to the whole project team, with everyone populating the chart with real time data from site as they do it.

Know what’s happened, know what’s happening, know what’s going to happen in the future.

We’ve come a long way since the paper Gantt chart that Henry came up with, but we’re still as excited to show people what our digital Gantt chart can do as we imagine Henry was back in 1910. And we’re equally fun at parties. Honest.

If you want a quick demo of what our Gantt charts can do, get in touch and we’ll take you through it.

Previous
Previous

From Awareness to Action: Simplifying Fatigue Management in Rail Operations

Next
Next

Investing in Construction Tech Start-ups: Traditional and Non-financial Investment Strategies